

I ran a workshop at the RCA last week on the topic of scale. I’ve been thinking about this for a while in the context of training sets for machine learning algorithms and the cognitive limits of trying to deal with the sheer number of data entities required. This has some profound consequences, not least the increasing political, commercial and cultural power that collecting and owning large data sets confers. A power in dramatic contrast to its costs – we have given Facebook its data gratis. The inequality of this ability to act in the marketplace of data driven effects flows directly from the difficulty of dealing with large data sets. Only very large companies, or those small ones who have attracted significant investment, are able to leverage the advantage of massive data. This means in turn that they they are the only ones able to offer sufficient incentive to the very few data scientists with appropriate skills. Pursuing the argument further, we can observe that the specialist knowledge required to automate the configuration of large data sets means the people most affected (that is, we neo-liberal subjects) are locked out of the dominant discourses around data driven experiences, and remain their passive consumers – posting comments to Instagram, listening through Spotify, updating LinkedIn profiles – with little thought to how our actions populate databases on a scale it is very difficult to comprehend.
A chance comment from a colleague related to how architects project their imaginative abilities up, from scale model to built environment prompted me to ask the question; what can we learn from how scale is handled in art and design that might be applicable to the field of massive data? There are a whole range of strategies that come to mind, from the pixillated paintings of Chuck Close, to Joseph Cornell’s boxes, Claes Oldenburg’s sculptures, and Tadao Ando’s models. Students were asked to go to a West London shopping centre, observe the space around them and annotate a grid with the various scales of human activity around them. The outcomes from this exercise included a variety of strategies.
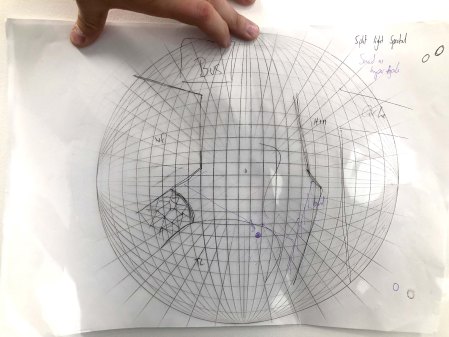 Evan Reinhold devised a spherical grid on which to annotate the various scales of sound in Westfield, from intimate conversations, phone calls and footsteps to the music that plays throughout the whole building.
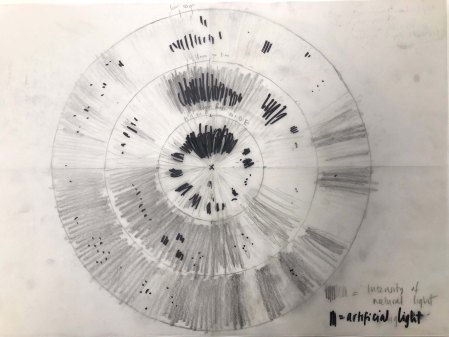 Claudia Soler Bernardini made a circular plot of the various light levels in Westfield. An inner ring shows the immediate personal context, the middle ring out to an approximate distance of ten metres, the final ring shows light levels over the whole centre.
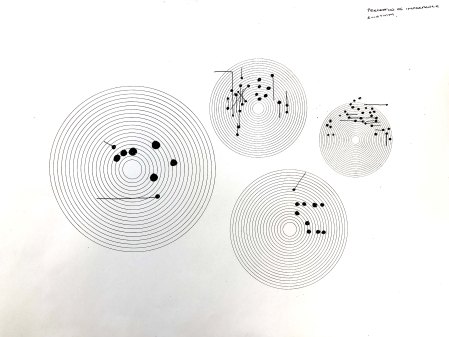 Henri Holtz showed how people move through the space, showing where people enter the from and where they end up. Her grid focused on the distance people travelled and the trajectory they took across an arrangement of concentric circles representing a specific area of the building
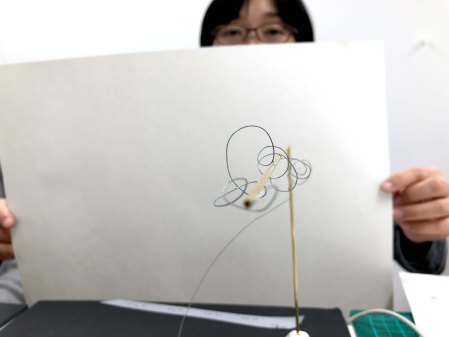
 Eriko Takeno made a mask to hold up in front of her face, on which she noted the sound sources around her, deliberately unaware of the distance and scale she was experiencing them at. The resulting notations are concealed behind a translucent paper layer to indicate the way they were only partially perceived.
The next step of the task was to make a more developed representation specifically of the relationships between different scales of data recorded in the space.

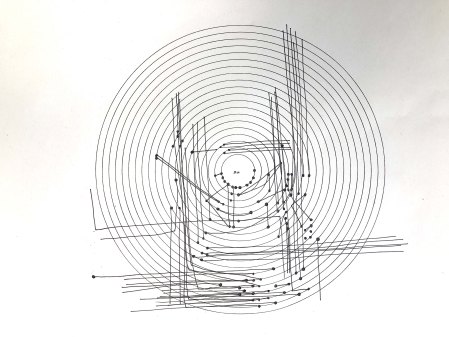
 Kumi Oda used the reciprocal strategies of compression and expansion to represent sound waves. A highly compressed aggregation of sounds has an expanded counterpart that can also be viewed in multiple axes. Applying this to data we can imagine that compression and expansion, currently handled in say zipping of large files, could be a far more interactive and decisive experience. The ability to scale the data manually using sliders or range adjustment would also afford a choice of resolution.
 Eriko used the metaphor of layers of transparency and opacity to explain the relative scales of data she experienced in the space.
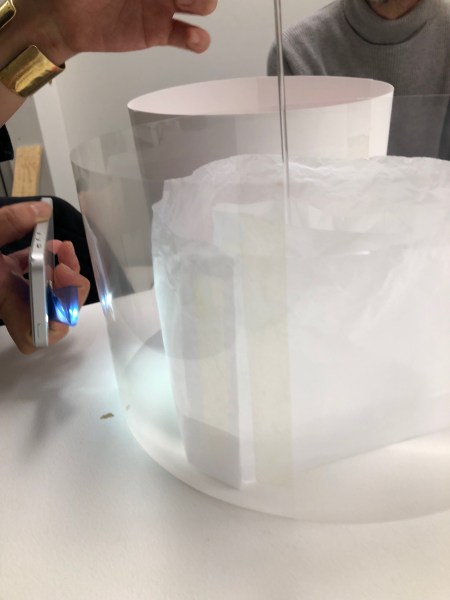 The strategy used here involves moving the subject relative to the object. Extrapolating this to a dataset we can imagine spatialising the data in a virtual environment and moving through the subsequent dimensional representation so that we could inspect multiple scales in a single view by assigning opacity values to various parts of the data that were related in different ways.
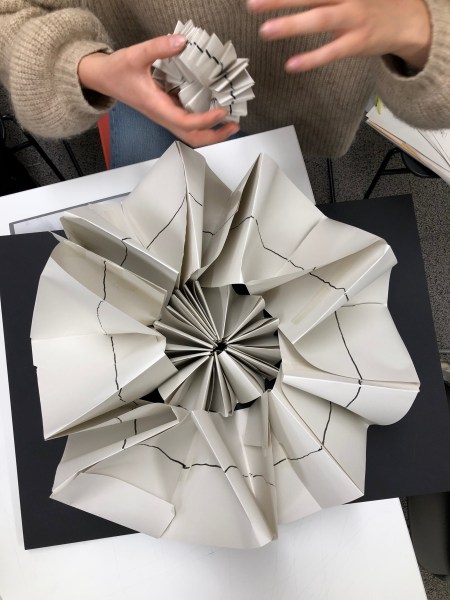
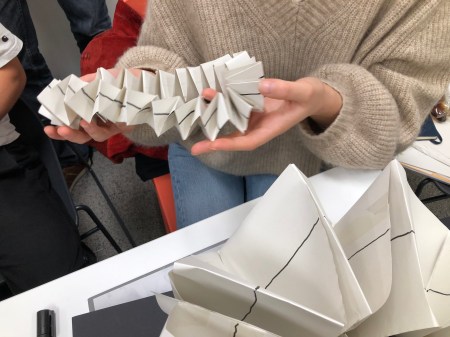
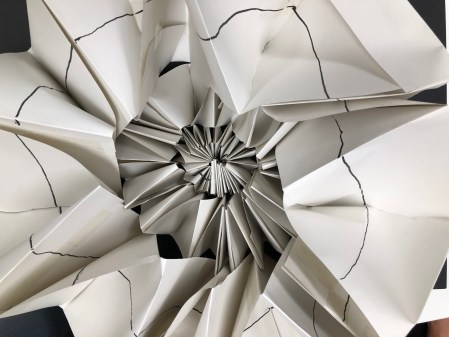 Henri Holtz’s concentric drawings ended up in the form of a multiply folded and nested paper form. The strategy here shows that by folding concentric rings in a particular way such that they can be expanded easily and then nesting them, a huge amount of data can be presented at increasing scales of resolution or magnification. Folded forms can be unfolded to different levels of detail. This design evoked the way the brain is folded, the folding of protein, and the complex folding of DNA. This is an effective way of showing different scales of the same data at the same time.
Claudia ended up with a hemispherical geodesic dome structure within which she imagines other smaller structures would be nested. This implied regularised stepping down of scales decreasing (or increasing depending on the direction of travel). Again a good way of handling the navigational challenges of large data sets.
Fabio Fidanza and Jack Smith created a way of abstracting scale to a set of intersecting intervals. By hiding and exposing the data in a rhythmic pattern they allowed for visual complexity mapping. This would be a useful indexing method for large data sets and would respond well to a sonic or filmic treatment. A rhythmical microfiche system with unique identifying signatures for interacting with varying degrees of complexity.
The imposition of constraints is described by Nigel Cross to be a decisive way that designers conceive the world, one he says that is very different to an engineering mindset. The constraints seen in the results of this workshop, the strategies of folding/nesting, expanding/contracting, intersecting/projecting were seen to be immediate ways designers dealt with problems of scale. One aspect was that these qualities presented as dyads, reciprocal characteristics of a single system, perhaps the basis for a more developed theory of how scale is dealt with in art and design.
